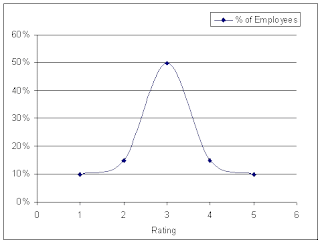
The %s may vary but this is the ideal kind of curve that organizations look for. If the organization is looking for a target and this is cascaded down to individuals, a rating of 3 would correspond to achievement of the target for everyone. Assuming that there are a few high performers (about 15-20%) and a similar % for employees who do not do as well as desired, we reach an average that corresponds to an average rating of 3.
The concept sounds fine as it helps the organization articulate the goal and cascade it down to individuals. However, the problem begins when the organization over-achieves or under-achieves the target that has been set. Being an employee (or even a function head), you would argue that if my function (or the entire organization) has surpassed its goals by a huge margin, why should I (or the employees in my function) be juxtaposed into the conventional bell curve. Should the curve not look something like :
And the other side, if the organization does not do that well, the obvious conclusion is that employees have not performed as per expectations and as a result the curve would shift towards the left:
Then why are we always stuck with being a point on the so-called bell curve regardless of the performance of the organization that we work for or of the function that we belong to!!!???


